For the first time ever, researchers have harnessed the power of big data to calculate the per-country greenhouse gas emissions from aviation for 197 countries covered by an international treaty on climate change.
When countries signed the 1992 United Nations Framework Convention on Climate Change treaty, high-income countries were required to report their aviation-related emissions. But 151 middle and lower income countries, including China and India, were not required to report these emissions, although they could do so voluntarily.
This matters because the United Nations Framework Convention on Climate Change relies on country reports of emissions during negotiations on country-specific emissions cuts.
“Our work fills the reporting gap, so that this can inform policy and hopefully improve future negotiations,” says Jan Klenner, a Ph.D. candidate at NTNU’s Industrial Ecology Programme and the first author of the new article, which was recently published in Environmental Research Letters.
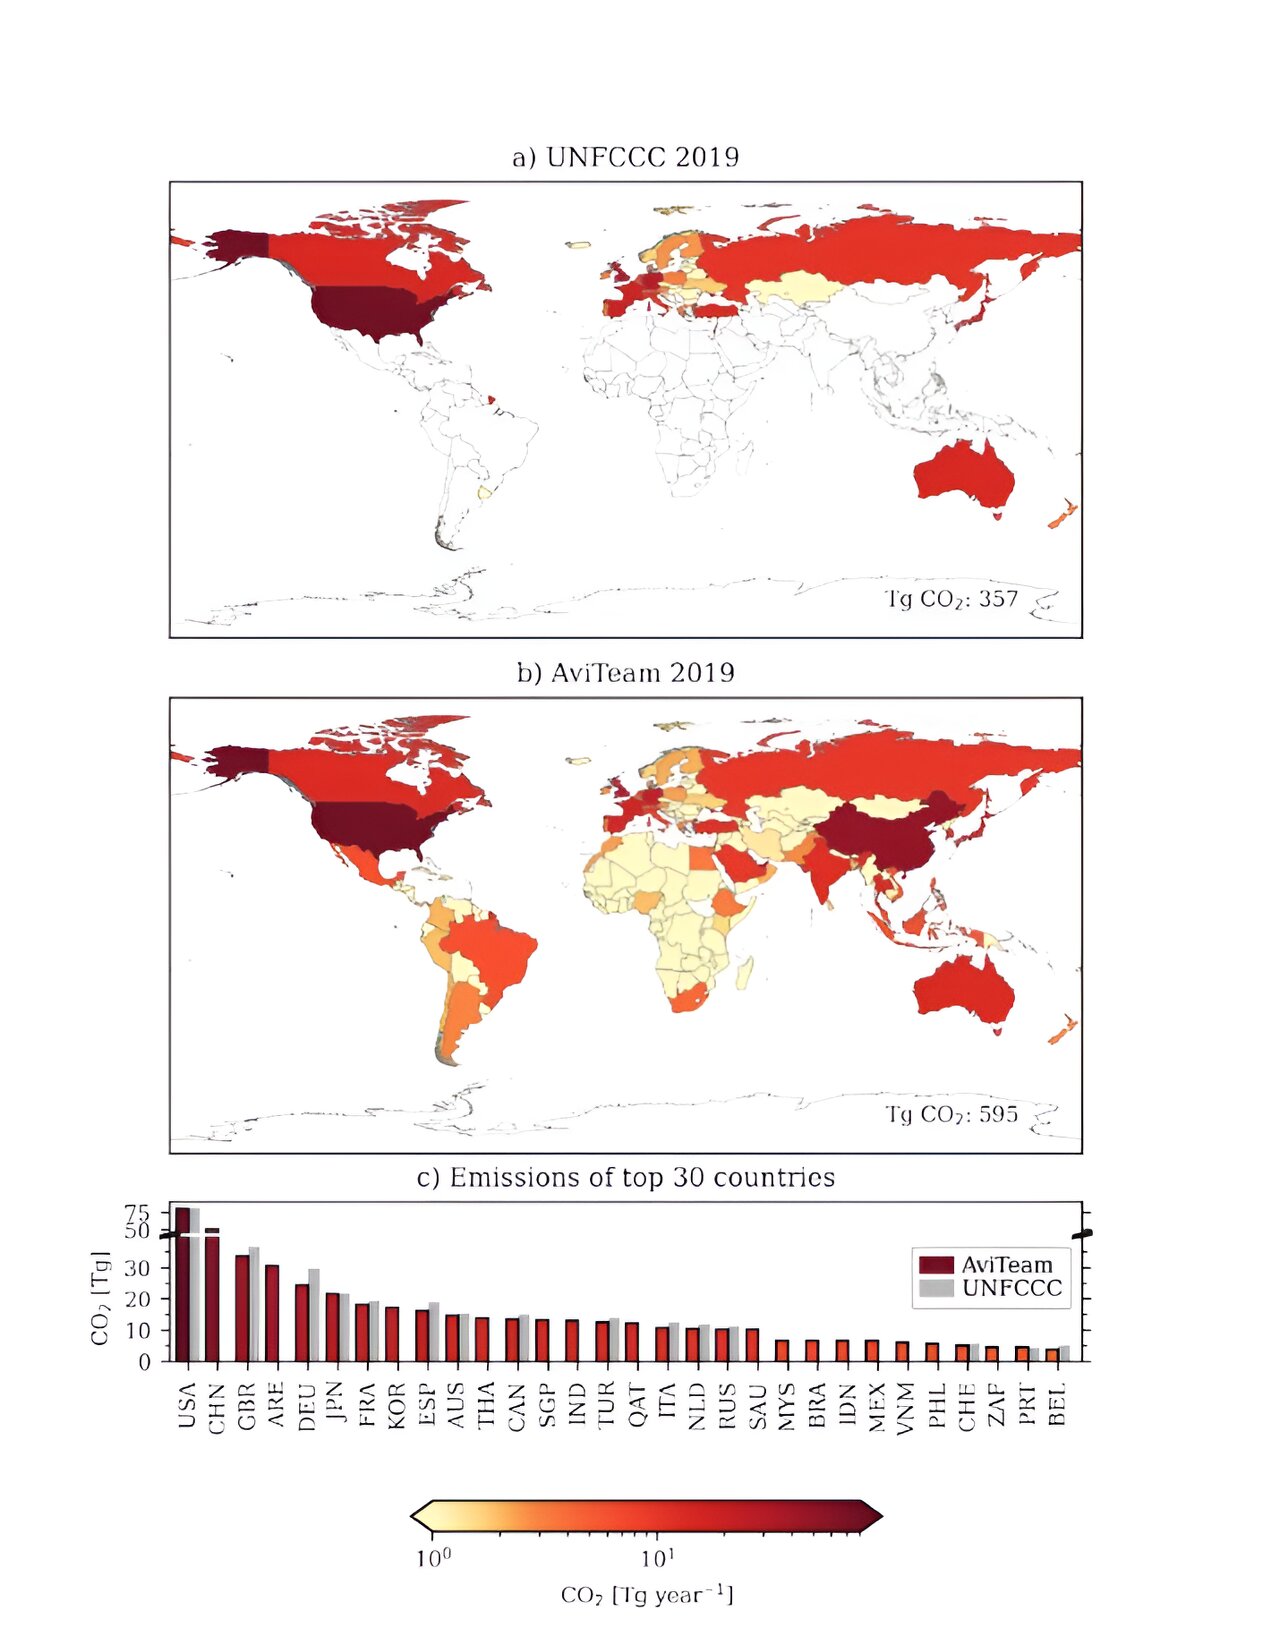
The new data show that countries such as China, for example, which did not report its 2019 aviation-related emissions, were second only to the United States when it came to total aviation-related emissions.
“Now we have a much clearer picture of aviation emissions per country, including previously unreported emissions, which tells you something about how we can go about reducing them,” said Helene Muri, a research professor at the Norwegian University of Science and Technology’s Industrial Ecology Programme. Muri was one of Klenner’s supervisors and a co-author of the paper.
Big surprises—or not
As might be expected, the United States is at the top of the list of emitters when it comes to the total sum of aviation emissions for both international and domestic flights.
“When we looked at how emissions are distributed per capita, we could see that economic well-being leads to more aviation activity,” Klenner said.
That analysis also showed that wealthy Norway, with just 5.5 million people, was third place overall, just behind the US and Australia, when domestic emissions were calculated on a per-capita basis.
Klenner tested the model he developed for this analysis by using data from Norway. He published a paper reporting those results in 2022.
You might think that Norway’s geography—a long, narrow country with lots of mountains and a sparsely populated northern area—would be the culprit behind the numbers. But Klenner’s 2022 analysis showed that fully 50 percent of Norway’s domestic flights were between the country’s major cities, Oslo, Trondheim, Stavanger, Bergen, and Tromsø.
“The per person emissions in Norway were incredibly high,” Muri, who also co-authored that paper, said. “With this data set, we can confirm that from a Norwegian perspective, we have a lot of work to do because we are third in the world when it comes to emissions per person from domestic emissions.”
A role for big data
Anders Hammer Strømman, a professor at NTNU’s Industrial Ecology Programme and Klenner’s co-supervisor, said one important aspect of the study is that it shows how big data can be used to help regulate climate emissions. Strømman is also a co-author of the new paper.
“I think it very nicely illustrates the potential in this type of work, where we have previously relied on statistical offices and reporting loops that can take a year or more to get this kind of information,” he said. “This model allows us to do instant emissions modeling—we can calculate the emissions from global aviation as it happens.”
The model, called AviTeam, is the first to provide information for the 45 lesser-developed countries that have never inventoried their greenhouse gas emissions from aviation. Strømman says the model provides these countries with information that might be otherwise difficult or impossible for them to collect.
The abillity to calculate nearly real-time aviation emissions could also provide an important tool as the industry makes changes to de-carbonize.
“In the transition where we’re talking about the introduction of new fuels and new technologies, this type of big data allows us to identify those types of corridors or operations where it makes sense to test those strategies first,” Strømman said.
More information:
Jan Klenner et al, Domestic and international aviation emission inventories for the UNFCCC parties, Environmental Research Letters (2024). DOI: 10.1088/1748-9326/ad3a7d
Citation:
Big data reveals true climate impact of worldwide air travel (2024, April 30)
retrieved 1 May 2024
from https://phys.org/news/2024-04-big-reveals-true-climate-impact.html
This document is subject to copyright. Apart from any fair dealing for the purpose of private study or research, no
part may be reproduced without the written permission. The content is provided for information purposes only.